|
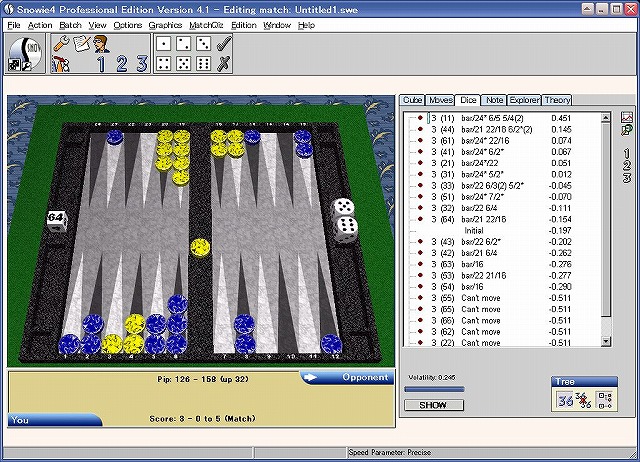
Snowie's Dice Panel, after 3-ply analysis
|
|
|
|
Cliking the  button
placed at the bottom right of the Dice Panel
displays 1-ply equities for all 21 (for 15 non-doubles and 6 doubles)
possible opponent's numbers in the panel area.
button
placed at the bottom right of the Dice Panel
displays 1-ply equities for all 21 (for 15 non-doubles and 6 doubles)
possible opponent's numbers in the panel area.
In order to have Snowie to analyze all the 21 cases
at 3-ply for more trust worthy results,
select all lines in the Dice Panel
and click the
 button at the right side of the panel.
Here's the readout of the Dice Panel.
|
Roll #
|
Equity value from
 's
point of view 's
point of view
(Snowie's output)
|
Equity value from
 's
point of view 's
point of view
|
| 11 |
0.451 |
-0.451 |
| 44 |
0.145 |
-0.145 |
| 61 |
0.074 |
-0.074 |
| 41 |
0.067 |
-0.067 |
| 21 |
0.051 |
-0.051 |
| 31 |
0.012 |
-0.012 |
| 33 |
-0.045 |
0.045 |
| 51 |
-0.070 |
0.070 |
| 32 |
-0.111 |
0.111 |
| 64 |
-0.154 |
0.154 |
| 43 |
-0.202 |
0.202 |
| 42 |
-0.262 |
0.262 |
| 63 |
-0.276 |
0.276 |
| 53 |
-0.277 |
0.277 |
| 54 |
-0.290 |
0.290 |
| 55 |
-0.511 |
0.511 |
| 65 |
-0.511 |
0.511 |
| 66 |
-0.511 |
0.511 |
| 62 |
-0.511 |
0.511 |
| 22 |
-0.511 |
0.511 |
| 52 |
-0.511 |
0.511 |
Just reading out the Dice Panel
doesn't give you much insight of the
position unless you look into it very closely.
Soring those values out into a dice table
may help you see the character of the position.
Let's see ...
| |
 |
 |
 |
 |
 |
 |
|
-0.451 |
-0.051 |
-0.012 |
-0.067 |
0.070 |
-0.074 |
|
-0.051 |
0.511 |
0.111 |
0.262 |
0.511 |
0.511 |
|
-0.012 |
0.111 |
0.045 |
0.202 |
0.277 |
0.276 |
|
-0.067 |
0.262 |
0.202 |
-0.145 |
0.290 |
0.154 |
|
0.070 |
0.511 |
0.277 |
0.290 |
0.511 |
0.511 |
|
-0.074 |
0.511 |
0.276 |
0.154 |
0.511 |
0.511 |
The dice table method really is easier to see
the whole picture of the position than just
simple list of equity vlues, but still
it is not very intuitive.
Something can be done to make the table
more intuitive or more visual,
so it is much easier for us to see
the characteristics of the position.
And, here's my answer for that "Something".
I converted those equity numbers into color,
from while to red.
The stronger red,
the stronger or the hotter
your position
('s position)
is.
The whiter,
the weaker or the colder
your position is.
Look:
I named this colored dice table method "Temperature Map",
as an (forced?) analogy of temperature map in a
weather forecast.