In reality, strength of both players can't be exactly the same.
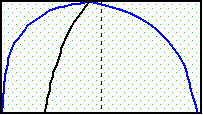
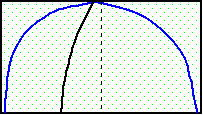
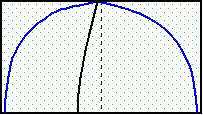
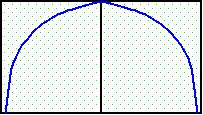
When difference in skill level between the two players is not small enough to ignore, the shape of the match equity chart changes, or "skewed", to take that difference into account.
The famous book Can A Fish Taste Twice As Good? written by Jake Jacobs and Walter Trice (and I call it "the Fish book" for short) introduced match equity tables that change according to rating points differences. The rating point system used in the table is the same system as the online backgammon server FIBS uses to rate players' strength of the game.
I borrowed some data from the Fish book to create these match equity charts. (Thanks to Jake Jacobs for permission to use the data in my pages.) The match equity table from which I took data are follows:
| Table # | Page | Rating point difference |
|---|---|---|
| T-13 | 32 | 0 (even) |
| T-15 | 34 | 100 |
| T-17 | 36 | 200 |
| T-19 | 38 | 300 |
Here are how those tables look like in match equity charts. (Note that the chart of T-13 is slightly differnt from the chart of Woolsey's equity table, mainly because in the Fish book 24% the gammon rate is used to derive the tables as oppose to 20% that Woolsey's table assumes.)
|
Rating Difference |
You are: |
Match Equity [%]
|
Opp. is: | Table # in the Fish book | |
| -300 |
|
T-19 (for fish) Full size GIF | |||
| -200 |
|
T-17 (for fish) Full size GIF | |||
| -100 |
|
T-15 (for fish) Full size GIF | |||
| 0 (even) |
|
T-13 Full size GIF | |||
| +100 |
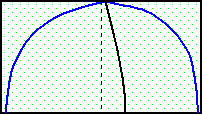
|
T-15 (for sharks) Full size GIF | |||
| +200 |
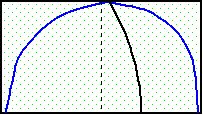
|
T-17 (for sharks) Full size GIF | |||
| +300 |
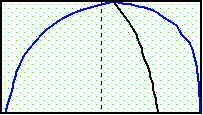
|
T-19 (for sharks) Full size GIF |